Appearance
Demand
Electrical Demand
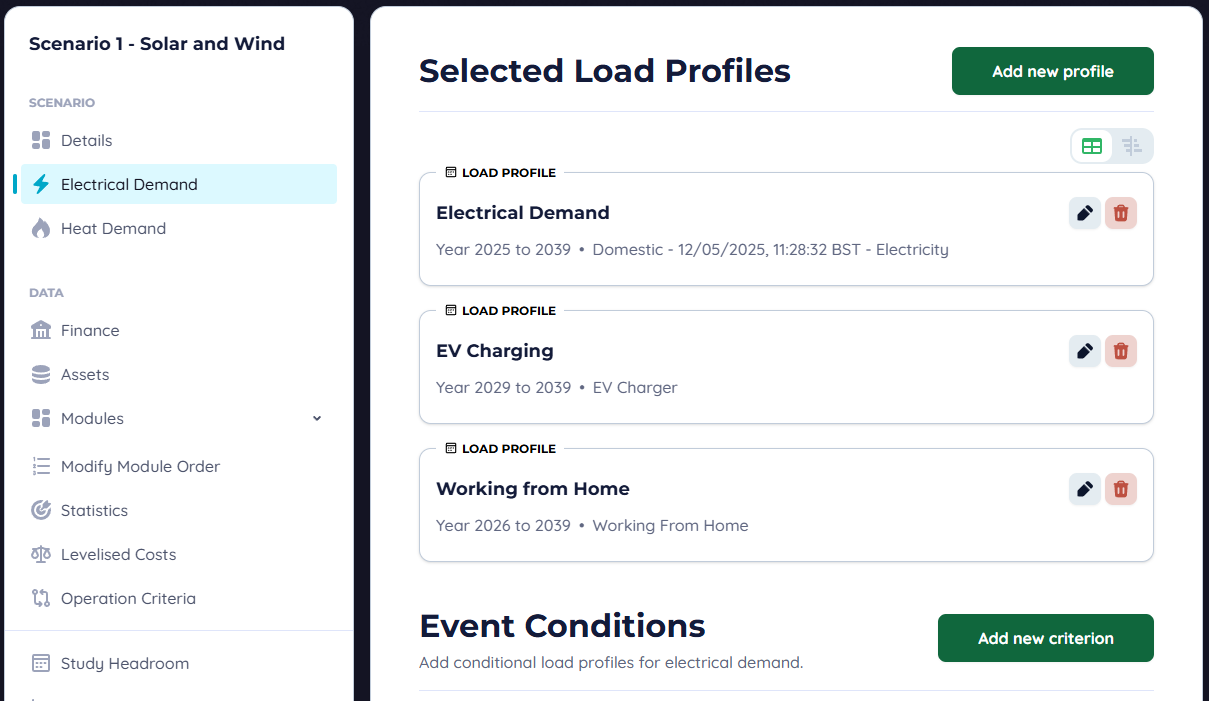
Electrical demand is the electrical load of your project, this is the amount of energy used by the site per half hour. You can add as many profiles as you like and they will appear on the electrical demand page once created, multiple active profiles are added together.
Creating a Demand
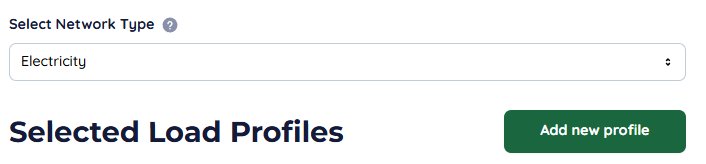
First, select the network you wish to add the demand to. Then hit "add profile".
Then you'll be brought to the profile form, these are the same for all networks and function in the same way. All values in the value maps will add kWh of demand.
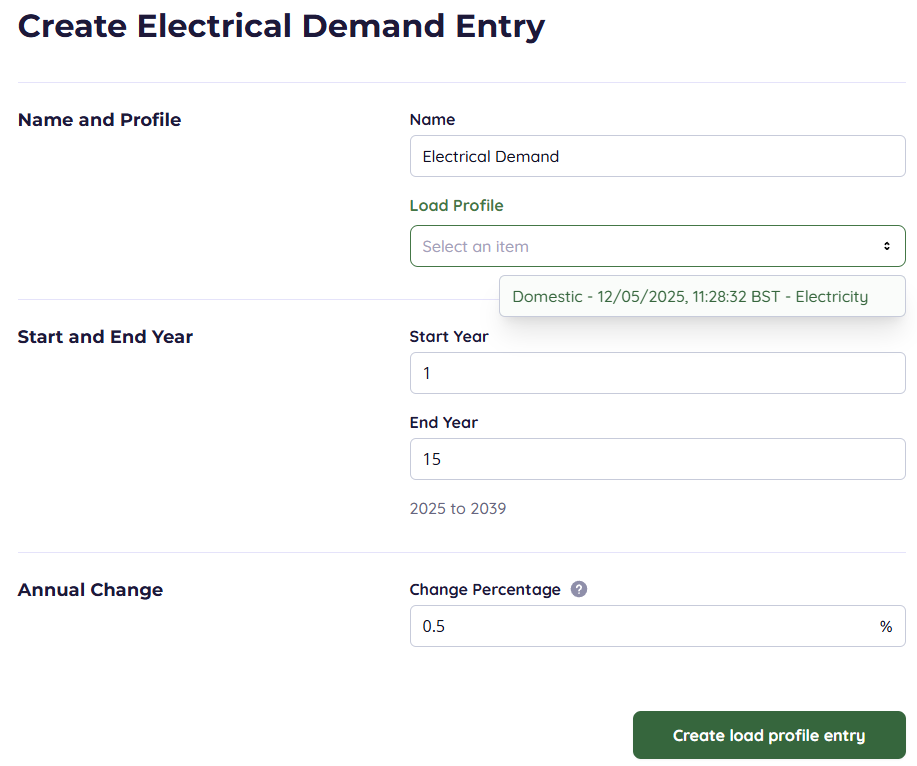
These options will then be visible:
- Name the demand something that defines what it measures. If you have multiple demands, this is important for clarity
- Start Year defines when the demand will start in the model
- End Year defines when the demand will end in the model
- Annual Change defines the amount of compound growth or reduction a value map will have per year, if generally electrical demand is increasing/decreasing year on year, this is an easy way to reflect that.
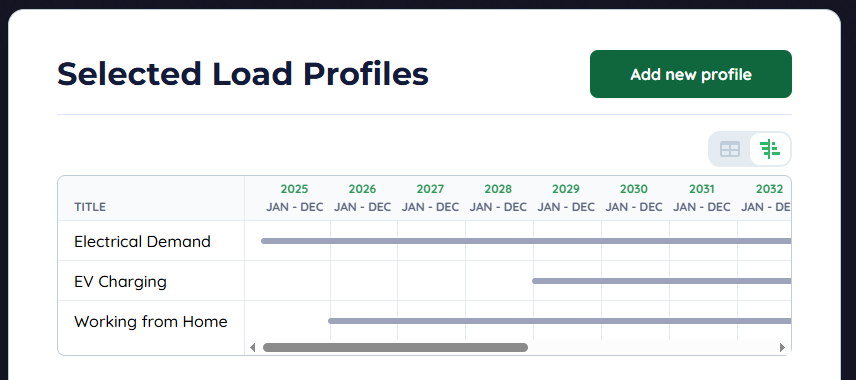
The Selected load profiles can then be viewed as a Gantt chart, this allows users to see when different demands become active, critical when you have several demand profiles.
Viewing and Checking Demands
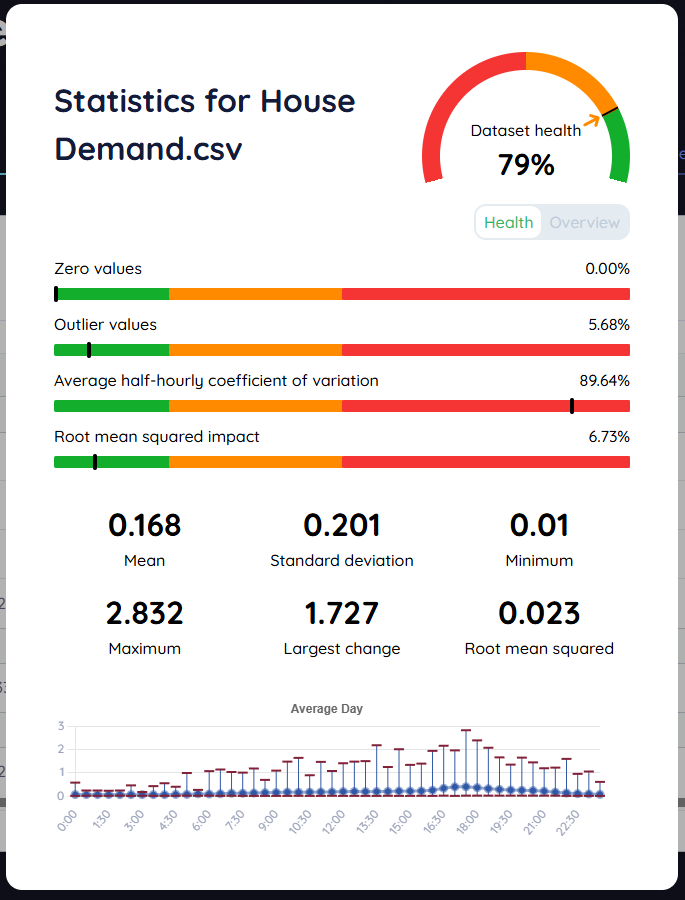
Every Value map uploaded has a statistics page which can be used to assess the quality and characteristics of the Value map. This gives a value of Dataset health, based on some useful factors
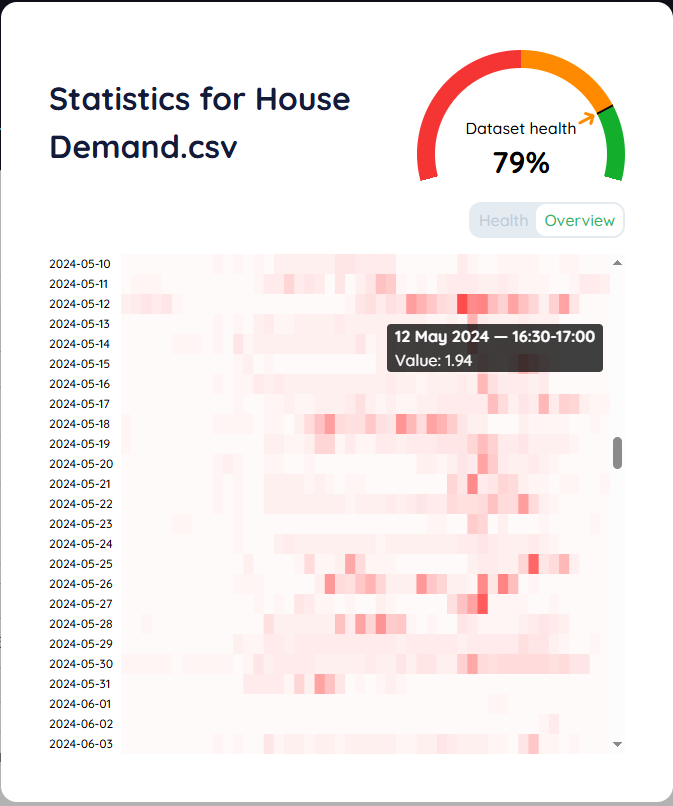
The overview page gives a heat map of where the high demand is, this is key to seeing where an issue is on a dataset. This data is from the same example of the overview above, the sharp increase in demand for the high usage in this house are what causes the coefficient of variation to be high. This is due to sudden demands in the evening, we can justify these as most likely being due to turning on the oven for dinner and creating a 2kWh/half hour demand.
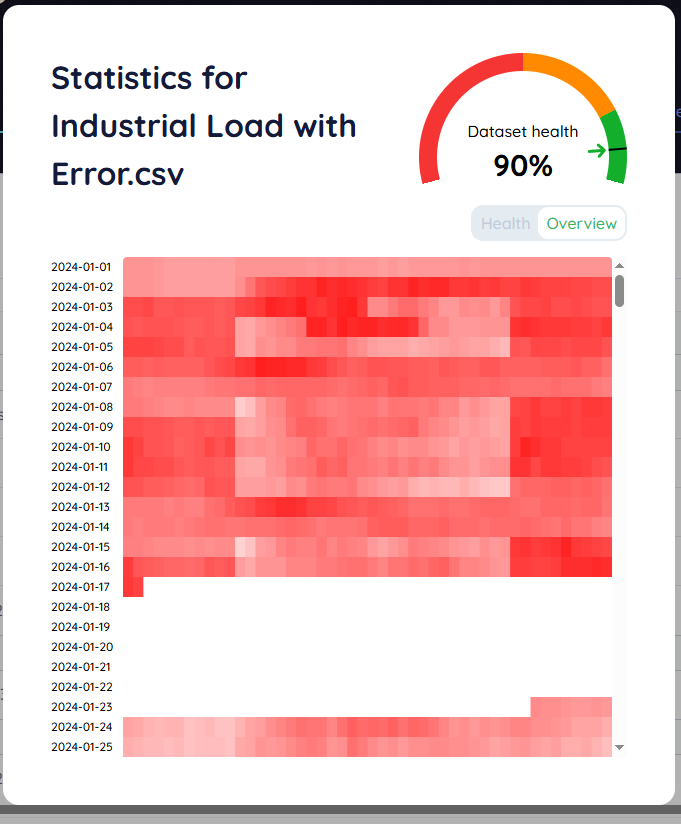
Using the Heat map in Overview, it is easy to find errors where the data has not been tracked by the meter, this large white block consists of zeros where a metering device was disconnected.
We always recommend checking through the quality of data uploaded to see if there are any issues that would interfere with model quality.
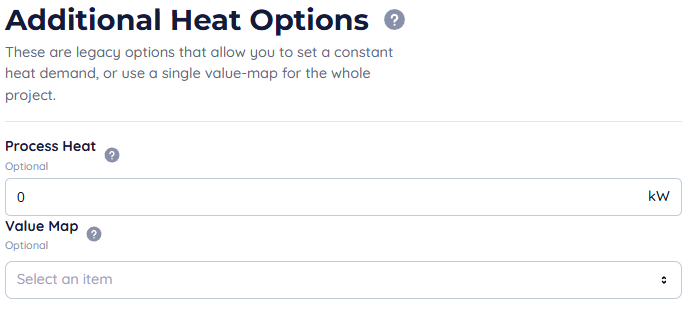
Heat Demand
Heat demand has two additional options on the profile index. These set the heat demand to be a constant or a value map across the length of the entire scenario. These options are a legacy feature and are not recommended and will eventually be deprecated.
Event Conditions
Event conditions are additional value maps that only appear when a certain condition is met, for either heat or electrical demand. They can be triggered from value maps or installation outputs. In the Electrical or Heat Demands page, below the demands there is Event Conditions, click "Add New Criterion" to create a conditional demand.
Creating a Condition
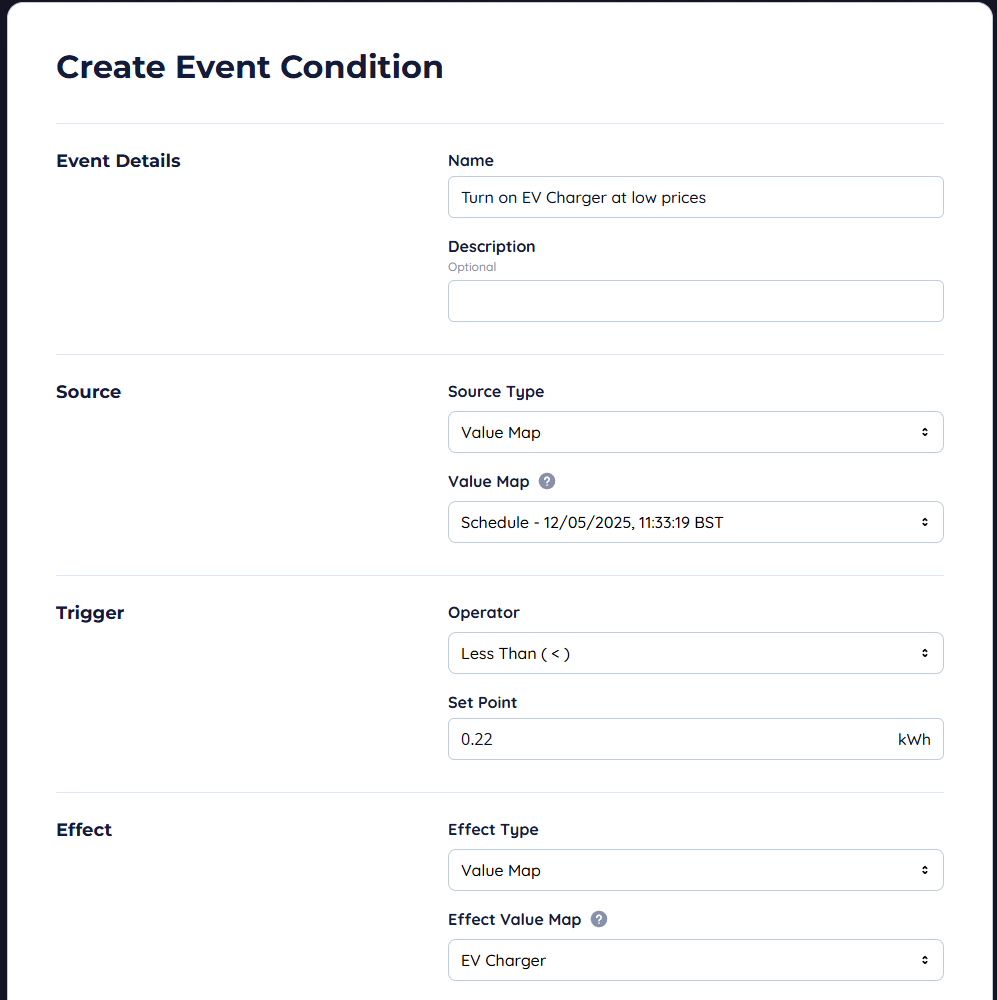
Once you've clicked, "Add New Criterion". Source type can be an installation or a value map. The set point will be compared to the value using the selected operator (SelectedValue→Operator→SetPoint). Effects can be constant or pull their values from a value map.
IMPORTANT
If an event is triggered its effects are carried over into the NEXT half hour.