Appearance
Reports
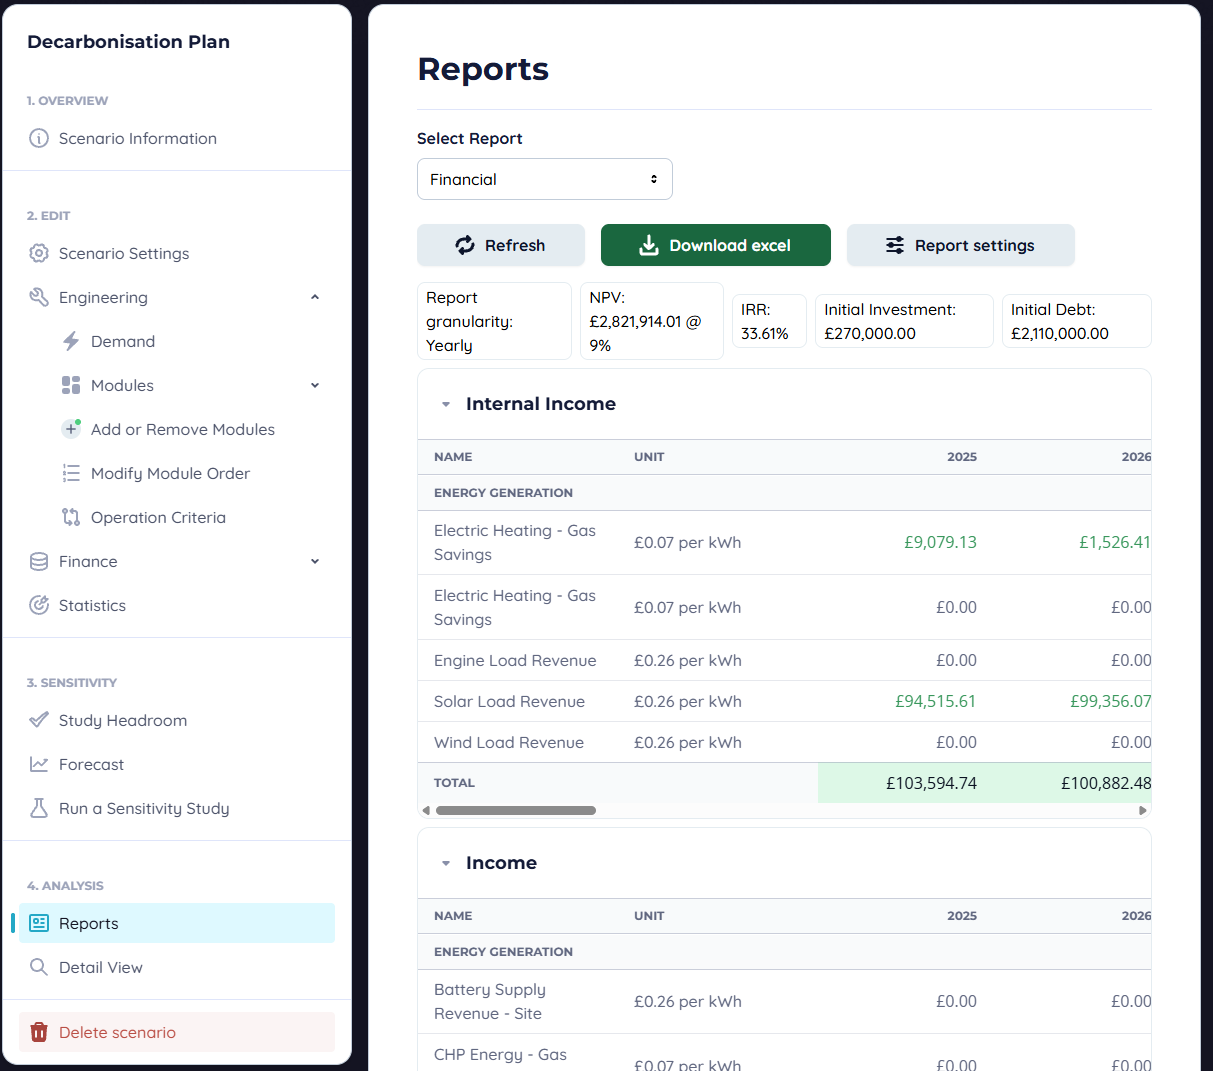
Display key numerical takeaways. Found in Reports pane of the scenario, selected from the side navigation. Select the report type to be viewed. 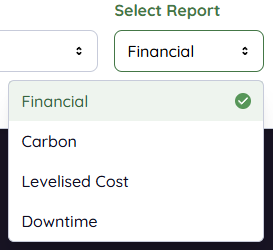
There are 4 types of report: Financial, Carbon, Levelised Cost, Downtime. 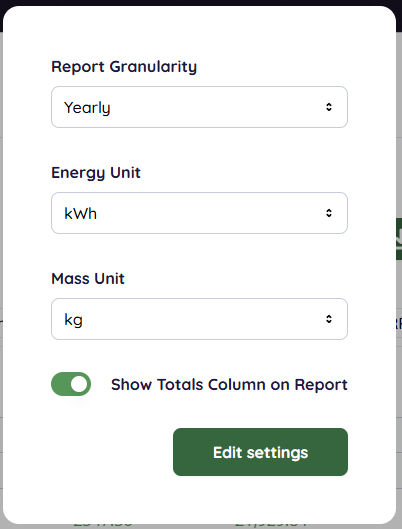
Report Granularity in "Report settings" this can be used to switch between yearly and monthly reporting, and edit the units used for energy and mass. If you do not need to see a total value for each statistic, you can turn this off with the Show Totals Column on Report button.
Financial Reports
Financial Reports have a summary at the top of them, this covers the key figures for a single look assessment at the project. This includes some abbreviations: NPV - Net present value (NPV) is the difference between the present value of cash inflows and the present value of cash outflows over a period of time. NPV is used in Encast for capital budgeting and investment planning to analyse a project's projected profitability. The NPV Formula:
Where Rt is cashflow at time t and i is the discount rate set in Financial Settings
IRR - Internal Rate of Return is the effective annual rate of return, or equivalently a theoretical discount rate that would bring the NPV to 0.
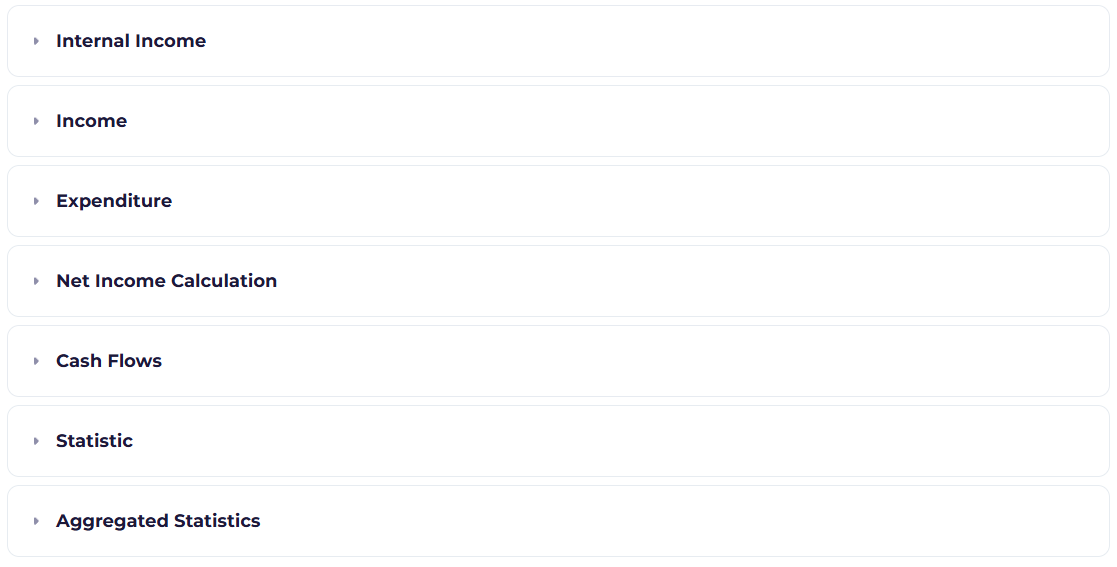
The report sections are collapsible, they contain all of the information required for a financial analysis of the project. The table below summarises their contents:
| Report Header | Description |
|---|---|
| Internal Income | Incomes that are not taxable such as savings on existing expenditure |
| Income | Incomes based on the PnL Entries that are not internal so could be taxable |
| Expoenditure | Expenditure based on the PnL Entries and Maintenance plans. |
| Net Income Calculation | Gross Profit, Pre-tax Depreciation/Interest/Amount/Earnings, Tax and Net income. This is used as a stepping point to the Cash Flows. |
| Cash Flows | Key figures such as Capital Expenditure, Cash Flow (CF), Free Cash Flow (FCF), Free Cash Flow to Firm (FCFF), Discounted Cash Flow (DCF). |
| Statistic | All PnL entries that are statistics will be shown here, they can be further broken down into categories by assigning them in the Profit and Loss menu. |
| Aggregated Statistics | Combined statistics that have been assigned in the Statistics section of the Scenario. |
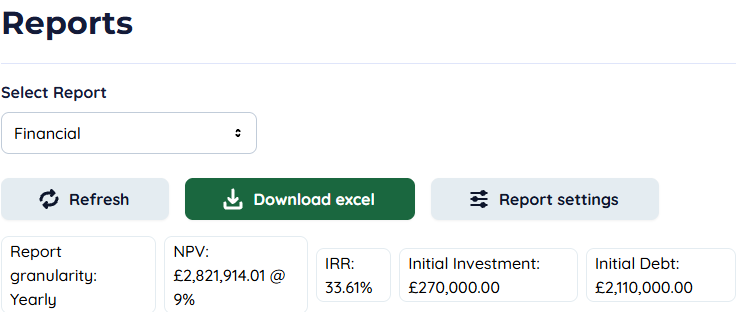
Downloading Excel
At the top of the Financial Reports page, there is the option to Download an Excel, a full report download will look like below:
Carbon Reports
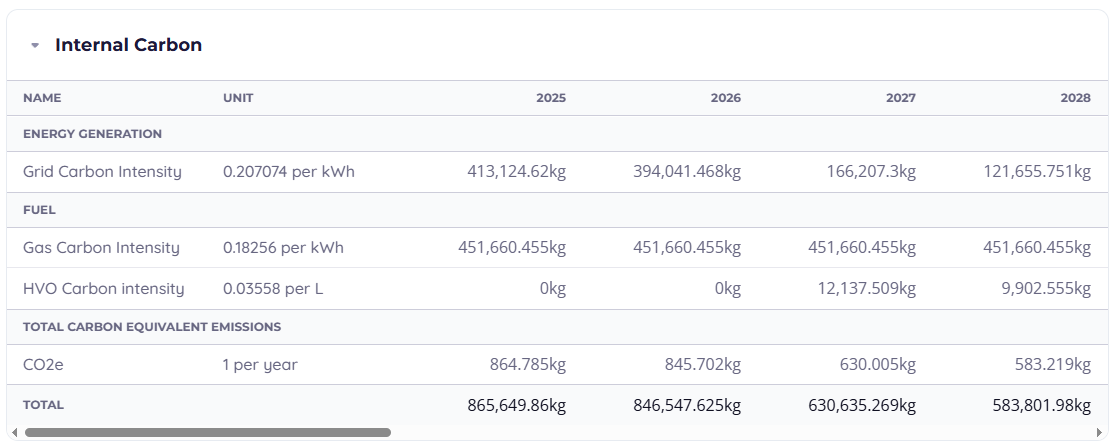
Internal / Carbon table - Profit & Loss Entries with Type "Carbon" can be viewed here. Statistics table - All Statistics entries.
Downloading Excel
At the top of the Carbon Reports page, there is the option to Download an Excel, a report download will look like below:
Levelised Cost Reports
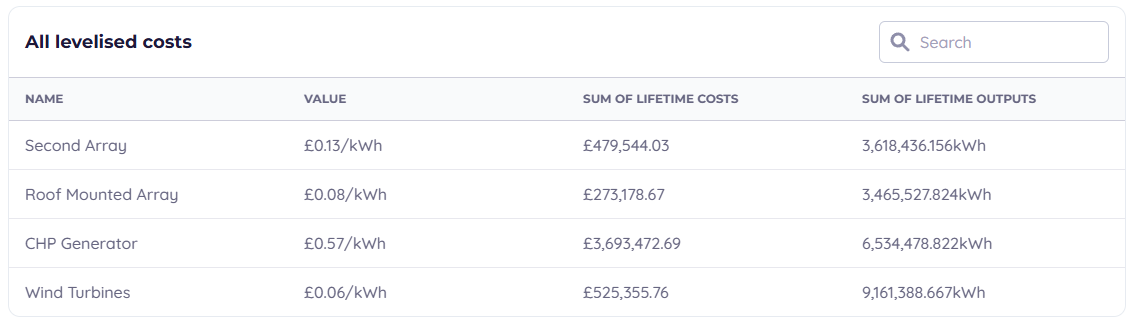
Display all Levelised Cost Entries created in the Levelised Cost section of the Scenario.
Levelised cost gives a summary of the lifetime costs of energy for an installation, this considers the cost of purchasing and maintaining an asset over time. Formula:
Discount rate: r chosen in Cost Analysis Parameters Lifetime: n based on Start/End year. Costs: It - Investment, Mt - Operational & maintenance - Ft - Fuel based on the Profit & Loss Entries & Assets selected.
Downtime Reports
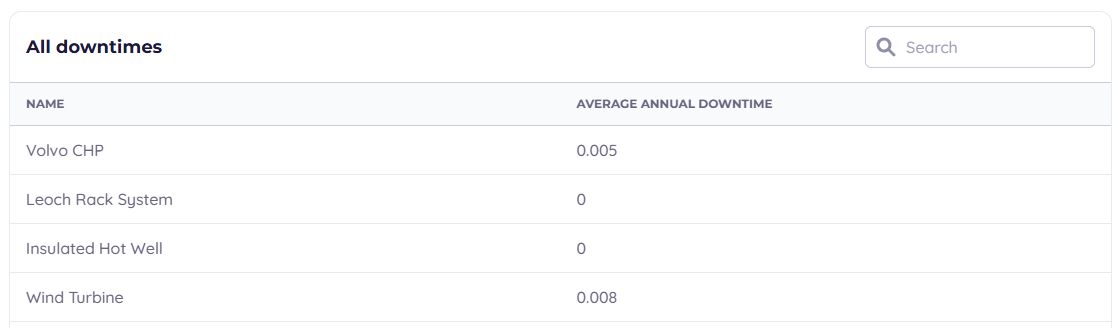
Display average annual downtime for all installations based on Maintenance Entries, this gives a summary