Appearance
Value Maps
What are value maps?
Value maps are used to define a year long series of half hourly values. This can be used for 3 discrete purposes:
- Electrical loads to define the energy required in kWh by the site that technologies should reach
- Thermal loads to define the heat used in kWh - this could be in the form of Gas used
- Profit and Loss Value maps define a cost or multiplier for a report. This could be price of fuel per day changing throughout the project.
These can be uploaded as 48 x 365.csv files or generated in Encast to give users as much flexibility as possible.
 These can be added in 4 different ways:
- Upload - provide a Value Map from your computer
- Industrial - Create a profile using generic Load information
- Domestic - Create a profile based on UK Standard house demands with provision for ASHPs and EVs
- Schedule - Schedule events that happen daily/weekly or demands that repeat consistently every week.
Uploading value maps
Formatting your CSV files
Value maps should conform with the following example templates:
Half Hourly is the most commonly used template however any index that is a factor of 48 (24 half hours) or is divisible by 48 can be used simply by changing the number of columns in the templates above to fit the number of data points you have for each day.
Dates in the CSV files must be formatted as one of the following:
- yyyy-MM-dd
- dd/MM/yyyy
- MM/dd/yyyy
Typically in accordance with the ISO format YYYY-MM-DD such as 2024-01-04 for the 4th of January 2024.
Value maps must be 365 days long with no repeated dates but may may start and end on any date.
Uploading
- Within your project navigate to the value maps section and select "Add value map" in the top Left hand corner and when prompted select "Upload"
- Fill in the following modal:
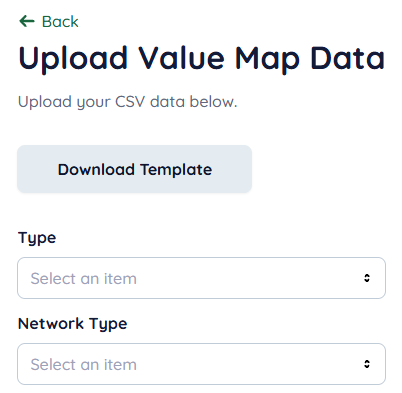
- Type (Demand, or Profit and Loss)
- Upload the.csv value map by either dragging or clicking on the button and selecting
- Units for electricity and gas should be in kWh. Toggle "convert to kWh" if your data is in kW. This happens if a meter is reading kW at a set time instead of energy used per half hour in kWh.
- Select the appropriate date format for the file you're uploading.
- Adjust comma separator settings if needed, European standards put a "." for 1.2, other standards use a comma which is where this is required.
Generating value maps
Industrial demand
- Within your project navigate to the value maps section and select "Add value map" in the top right hand corner and when prompted select "Upload"
- Fill in the following modal:
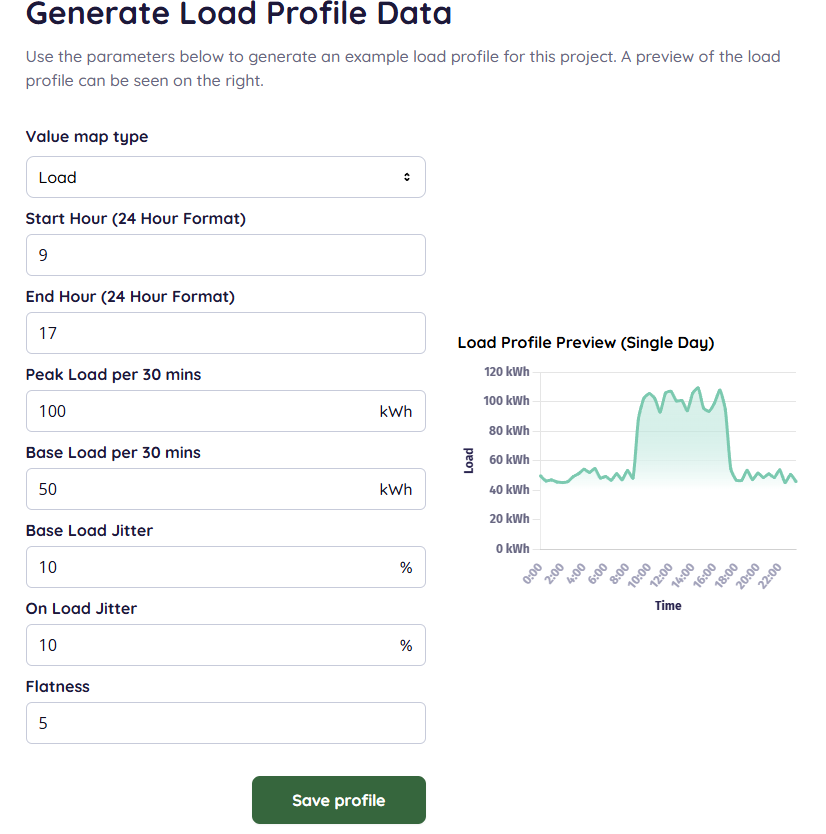
Generate Electrical & Heat profiles by defining the peak and base loads, this can be setup to simulate a daily load pattern on the site.
- Value Map Type indicates if this is an Electrical, Thermal or PnL Value Map
- Start hour defines when the peak demand begins
- End hour defines when the peak demand Ends
- Peak Load per 30 mins The peak demand of the site in kWh per half hour. A 100kW demand, is 50kWh/half hour.
- Base Load per 30 mins The base demand of the site in kWh per half hour. A 100kW demand, is 50kWh/half hour.
- Base / Peak Load Jitter How much variation is expected from the Base load / Peak Load setting, randomly added or taken away from each to create variations.
- Flatness defines the way the Peak Load looks, choose a number from 1-5 to edit the characteristics of the demand. This is how quickly it rises and reaches a steady state.
Domestic demand
- Within your project navigate to the value maps section and select "Add value map" in the bottom left hand corner and when prompted select "Upload"
- Fill in the following modal:
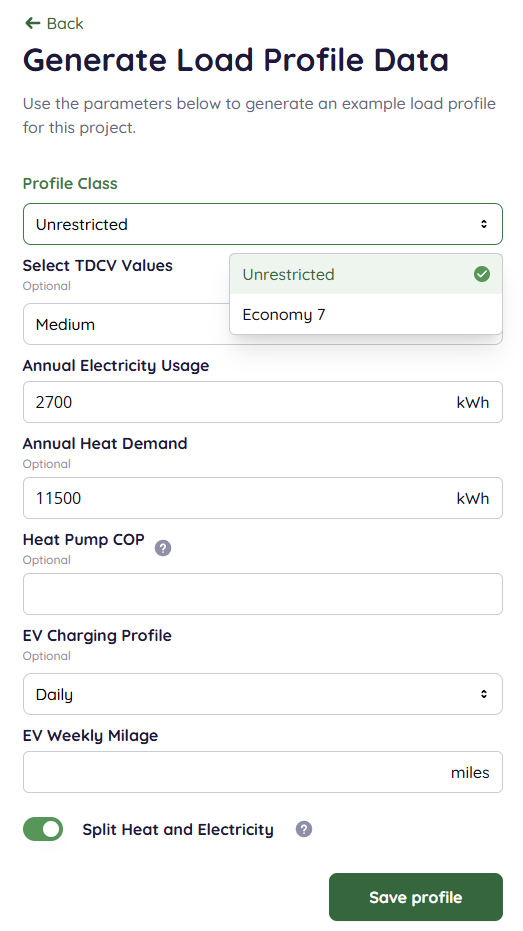
Domestic Load Profiles can be generated from Typical Domestic Consumer Values. This gives an average load of a house based on either Low-Medium-High typical settings or annual usage data.
Electrical demand is simple, heat demand creates an electrical demand based on COP of the heat pump.
This load profile generator also creates profiles for charging EV's. This is specified as an average definition for household vehicles with charging profiles for charging every evening, only in weekdays and only on weekends.
Schedule
- Within your project navigate to the value maps section and select "Add value map" in the bottom right hand corner and when prompted select "Upload"
- Fill in the following modal:
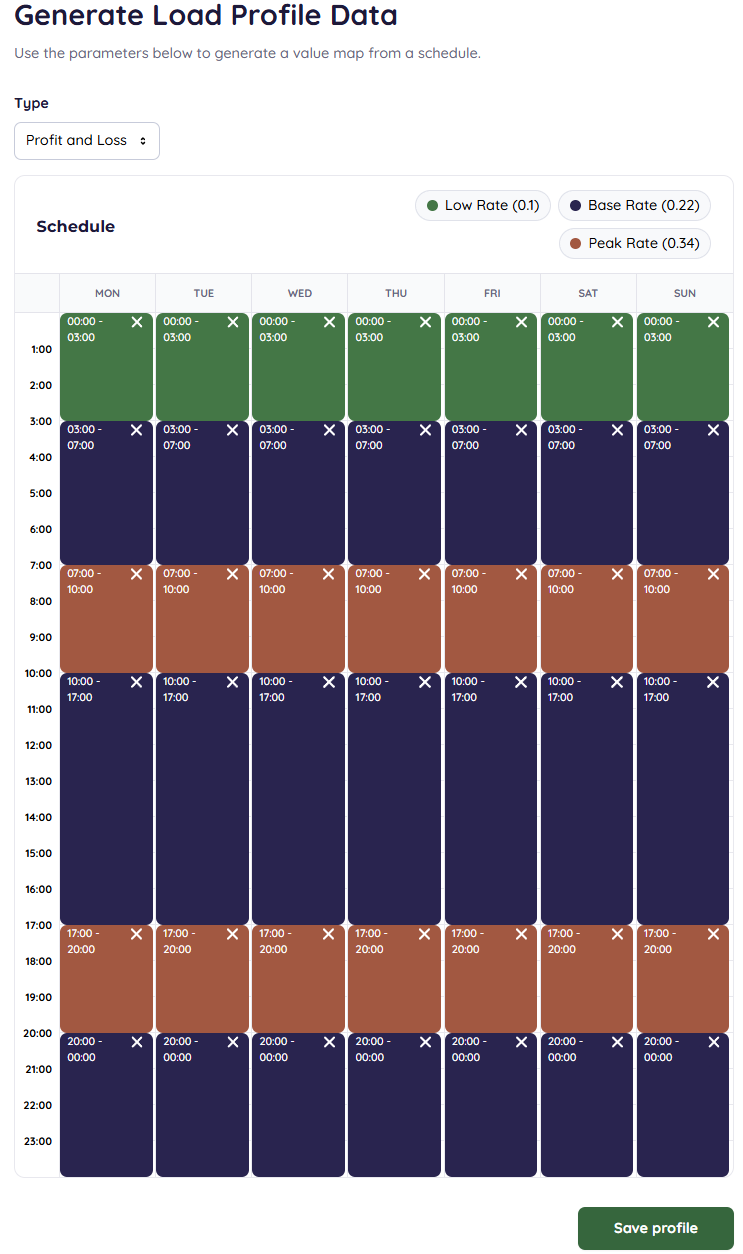
To add a value map in blocks of demand or a value for profit and losses per week, the scheduling tool can be used. This can be used for discrete operation times in conditional operation or pricing models for electricity hourly costs. Select the value map type: Electricity Demand, Heat Usage, or Profit and Loss. Then drag and drop sections on the scheduler.
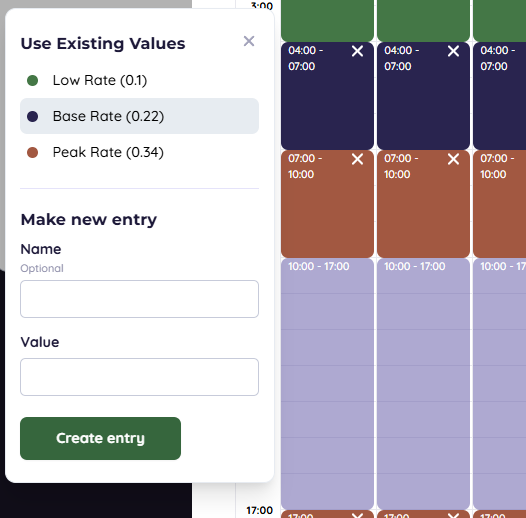
When dragging over an area, you can either name an define a new value, or click on the previously added values to reuse those. This saves repeated typing and makes the process quicker. The example above is an example of a pricing scheme for energy that changes with time. This has 3 different rates which can then be used in the model for changing the electricity prices. Operational Criteria can then be used to force a battery to charge overnight on the low rate energy.
Profile and loss
Value maps can be used to control functions using Operational Criteria or apply variable pricing over a year's forecast in advanced Profit & Loss. These are advanced functions, they may not be within your license or something you need to use.
Viewing and checking value maps
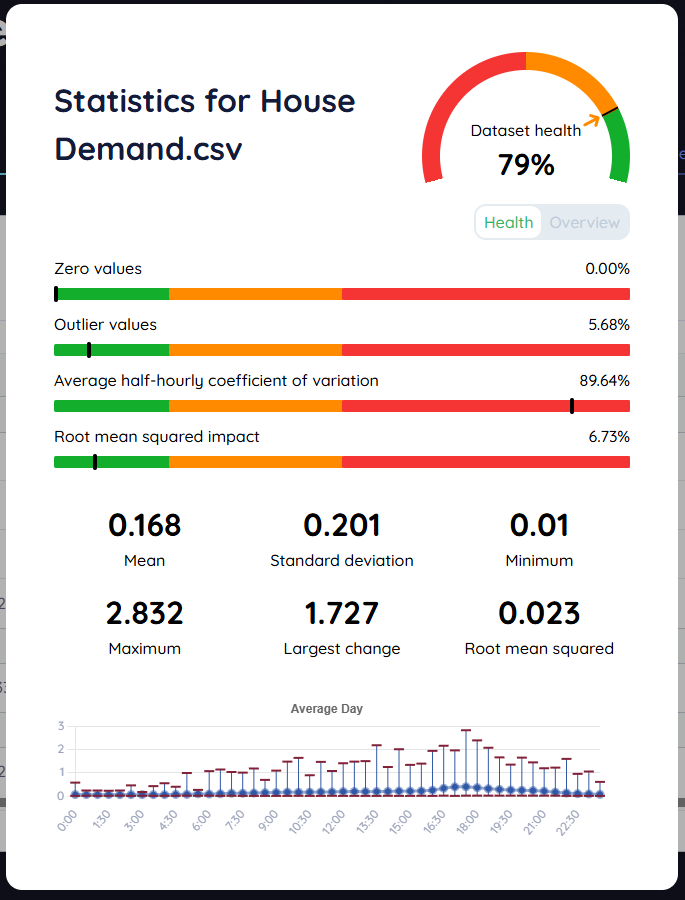
Every Value map uploaded has a statistics page which can be used to assess the quality and characteristics of the Value map. This gives a value of Dataset health, based on some useful factors
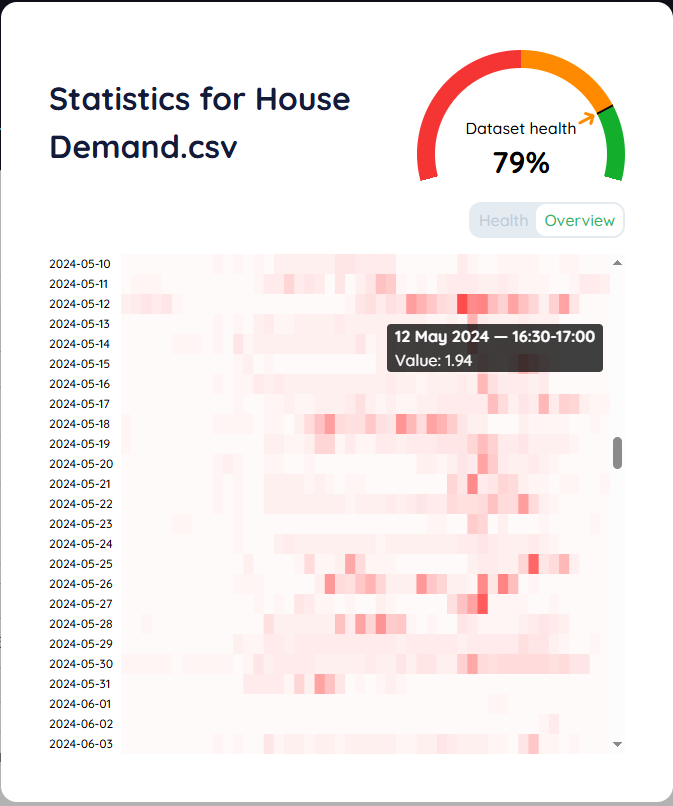
The overview page gives a heat map of where the high demand is, this is key to seeing where an issue is on a dataset. This data is from the same example of the overview above, the sharp increase in demand for the high usage in this house are what causes the coefficient of variation to be high. This is due to sudden demands in the evening, we can justify these as most likely being due to turning on the oven for dinner and creating a 2kWh/half hour demand.