Appearance
Detail View
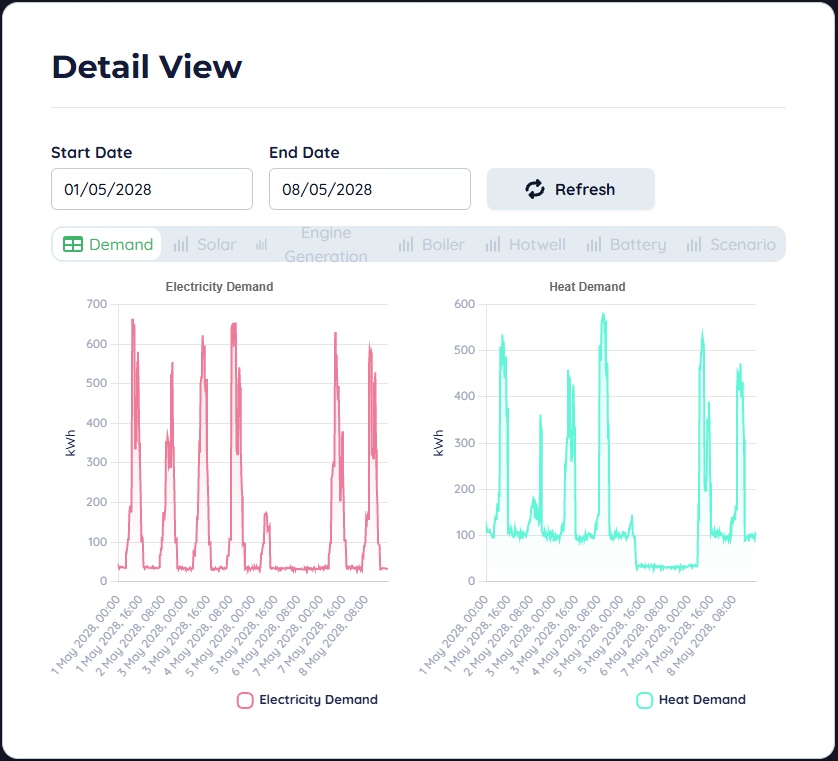
Generates graphs at half hourly resolution for any period of 28 days or less for every installation. Found in Detail View pane. Select the start and end date. Panes for each module, demand, headless. Module panes only if active installations in selected period. Visualisation with relevant series for each installation, plus aggregated chart if multiple installations in module. Unrelated to user-generated profit and loss entries.
The example above shows one way of using the detail view, selecting 2 days of the model of interest, picking a module to look at and then clicking on the legend names at the bottom of the graph to only select one set of data to look through.
This shows the kWh produced per half hour, if you want to read this as kW produced, double the figures seen, in this case we are highlighting a half hour producing 118kWh, this is 236kW of production.