Appearance
Tutorial 3—Additional Systems
Module Order
Encast treats modules in a stack concept. With demand at the top of the stack and filtering through modules until it reaches the bottom.
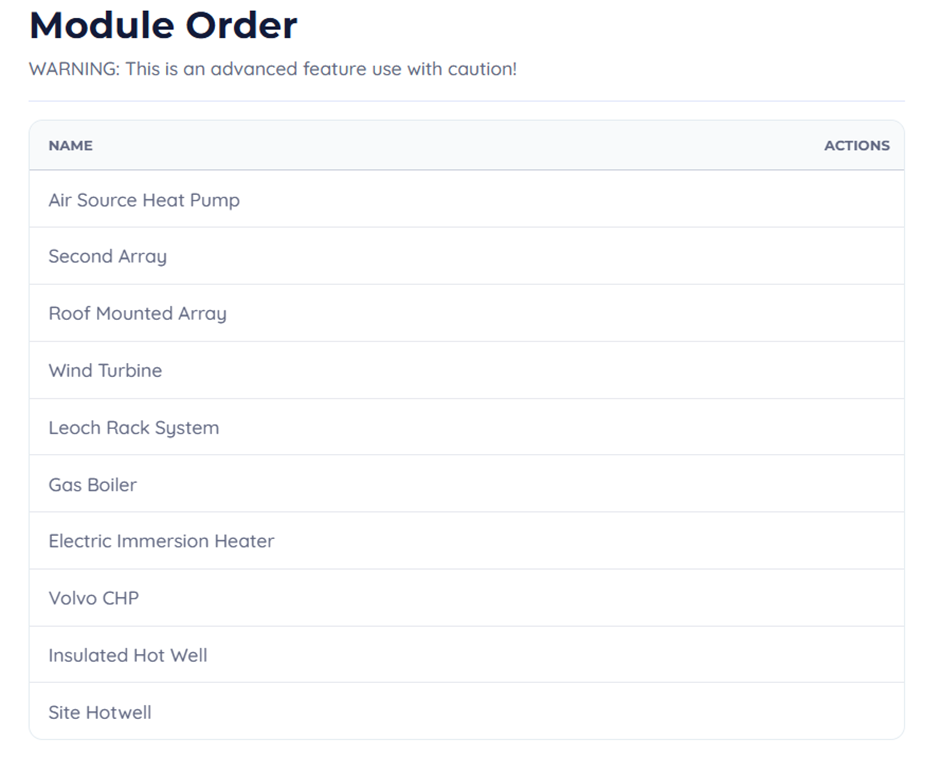
This stack can be reordered to get various effects. By default, renewable energy is on the stack first followed by electricity storage, heat sources, then ICE engines and gas turbines with heat storage last.
In the image above the order has been customised to place air source heat pumps first. To change the order, click and drag each module into the desired order then his save. To reset the order to default, hit clear order.
Sensitivity Studies
Sensitivity studies are a quick way of creating new scenarios and changing multiple variables at once.
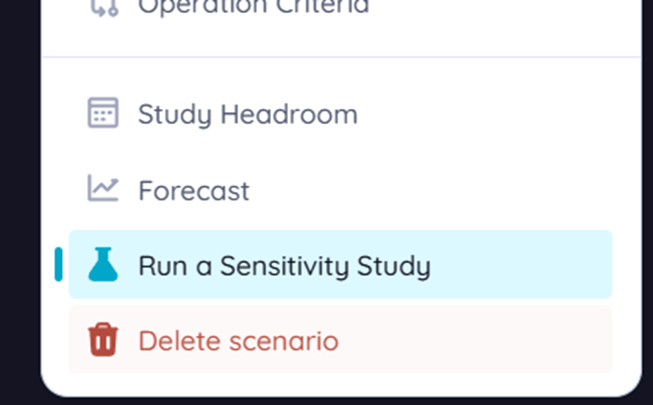
You can find them near the bottom of the scenario side navigation.
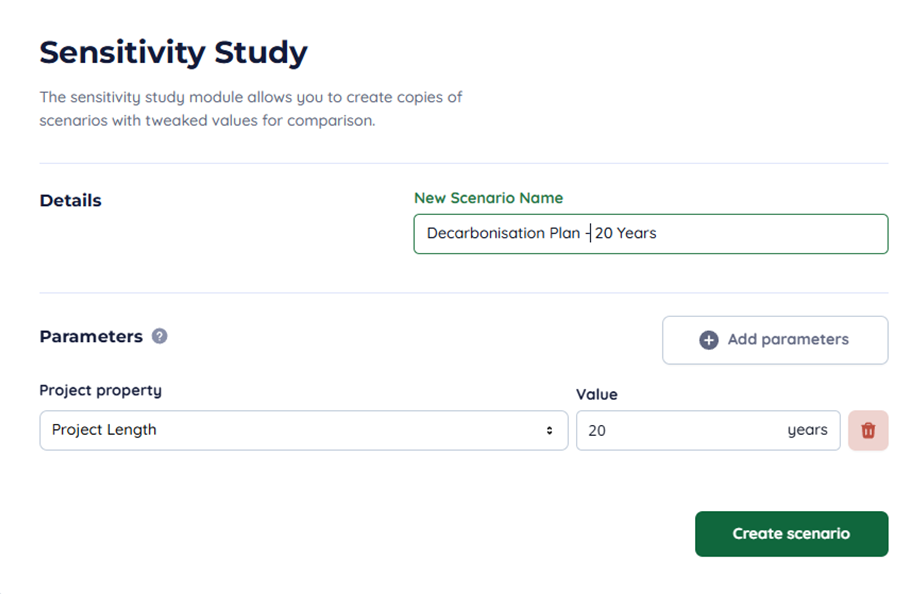
Add parameters and a new scenario name. There are a huge number of parameters you can choose from in a busy project, so you may need to use the search function. When you hit "create", you will automatically navigate to the new scenario.
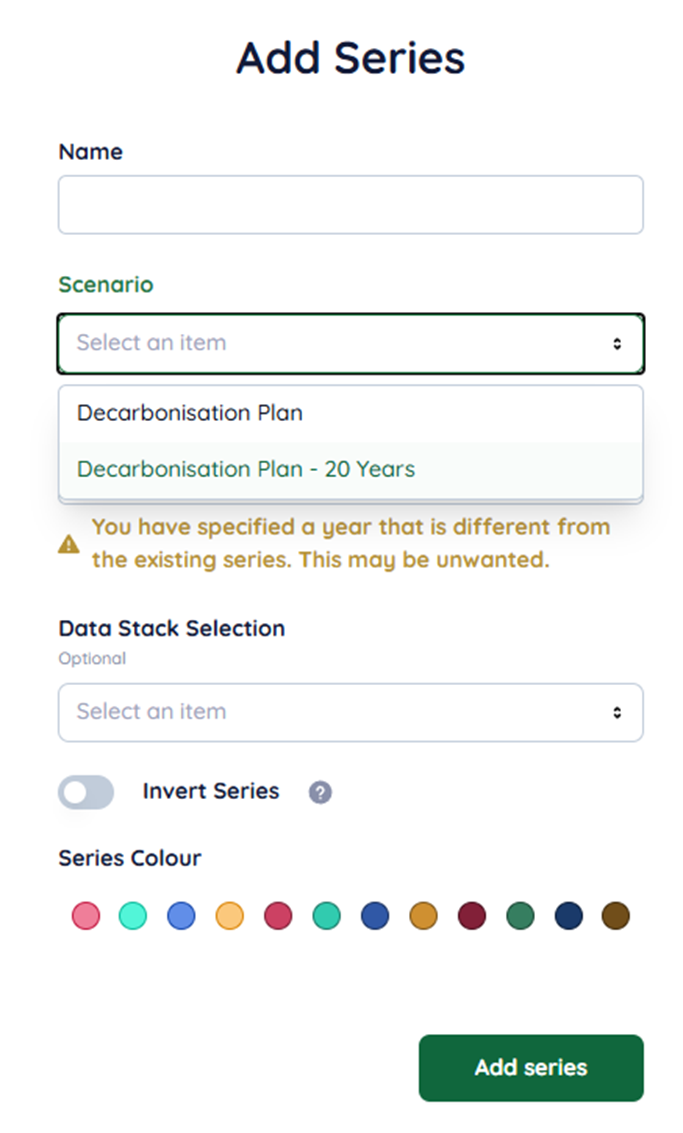
To compare results between scenarios, you can select the new scenario when adding a series in a chart.
Advanced Profit and Loss Examples
The profit and loss feature has many ways to influence the results. This includes using a value map rather than a static value for things like grid electricity pricing or fuel.
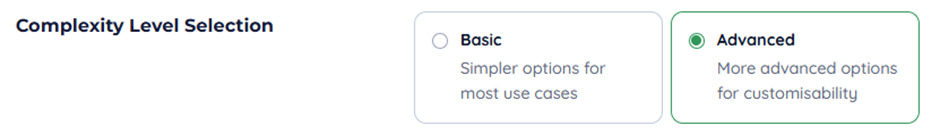
To access these options, switch the profit and loss complexity to advanced.
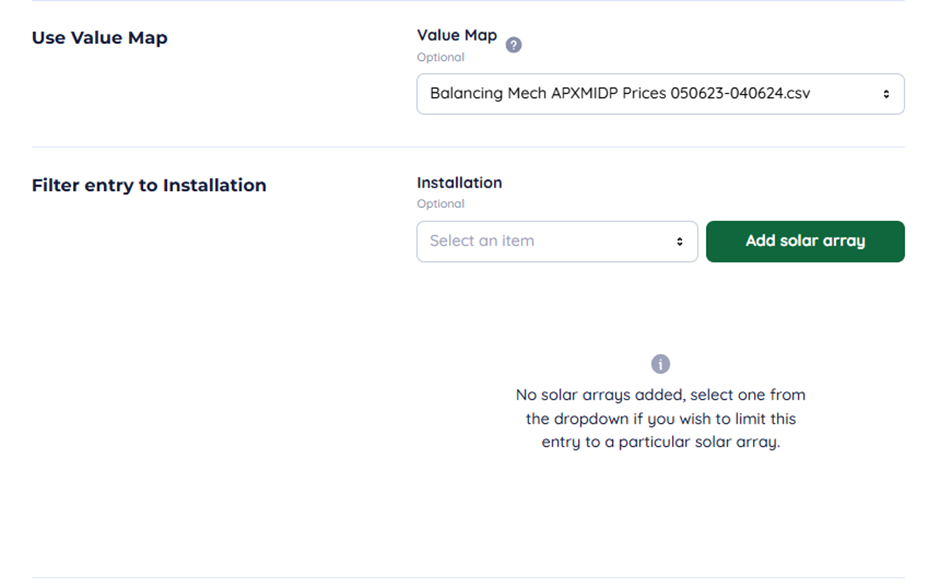
Options for value maps and installation filtering should appear, this allows you to select specific installations to apply the entry to rather than all installations in a module.
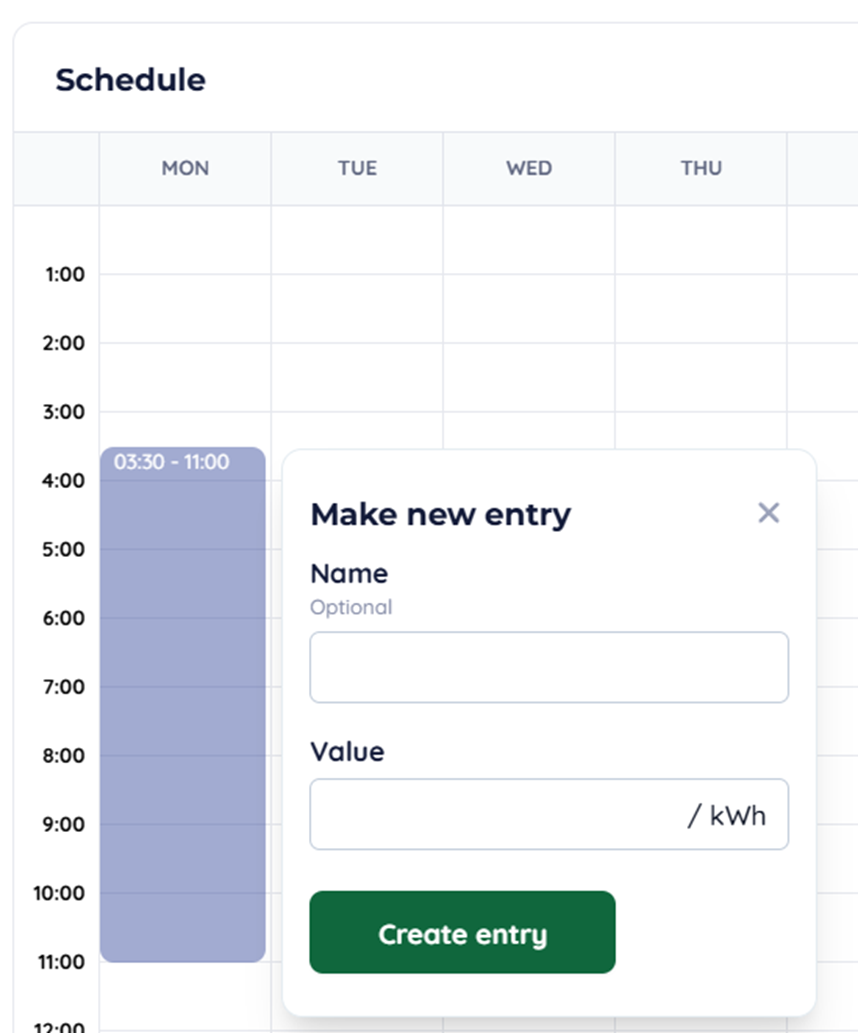
You can also apply values in a schedule. This allows you to create a weekly schedule of values or costs if you know that the value isn’t going to remain the same but will vary regularly during a week.
Operational Criteria
Operational criteria are a powerful tool to take the complexity and control over your system to the next level. These can directly interact with multiple different systems such as value maps, installations and other data to be able to model sophisticated external effects on your project.
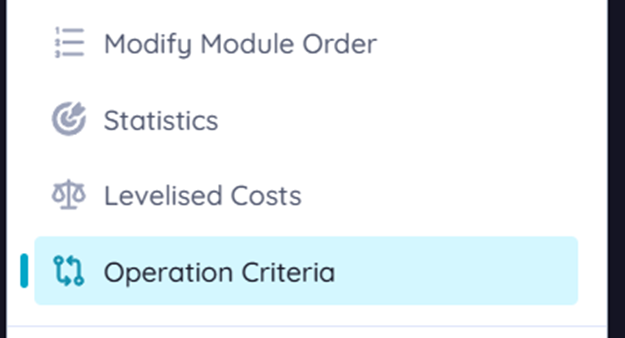
You can find them on the main scenario navigation. Criteria have three primary parts, the source, trigger and target.
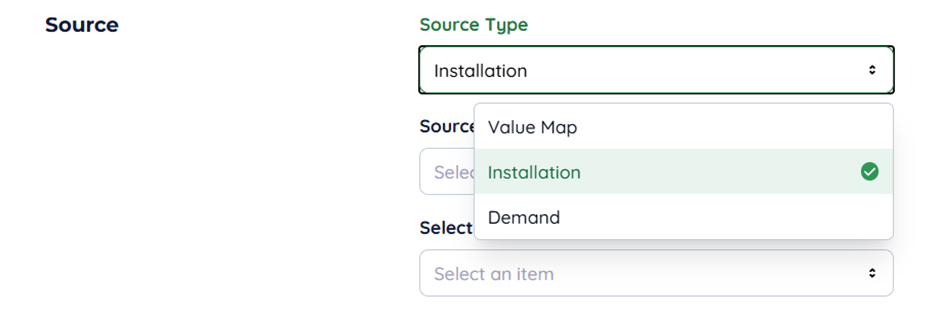
There are three source types, value maps, installations and demands.
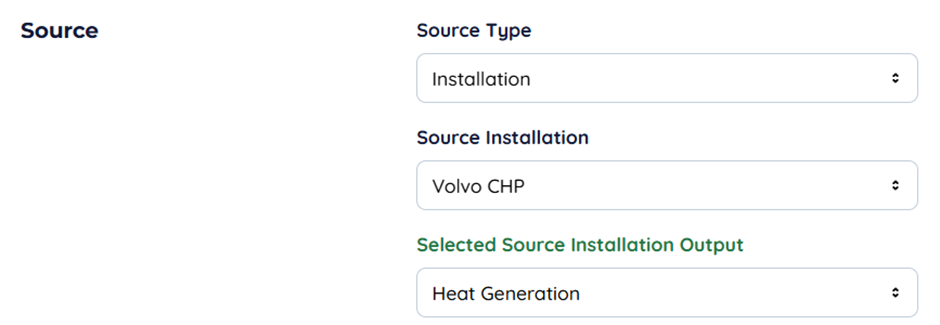
An example illustrated above is heat generation from an ICE CHP system. Demand in this case refers only to electricity in the current build, criteria are checked after any events which are explained in the next section.
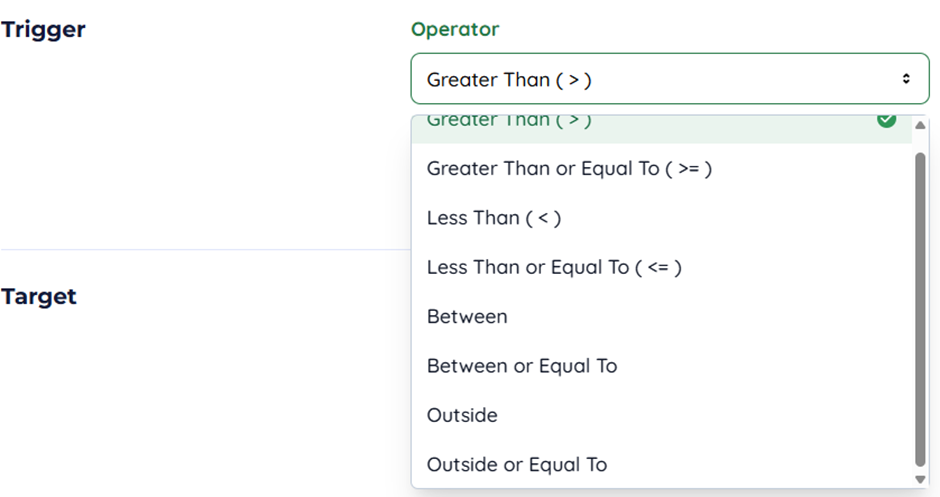
The second component, the trigger, can be any of several different logical operators.
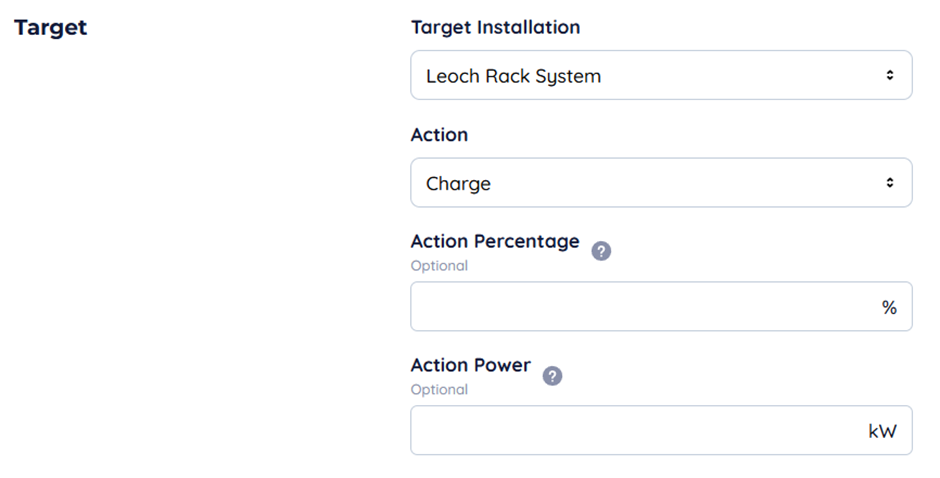
In an example targeting the battery here, when the condition is met, the battery will attempt to charge at its maximum rate. We could trim this by setting a percentage or fixed value rate of charge.
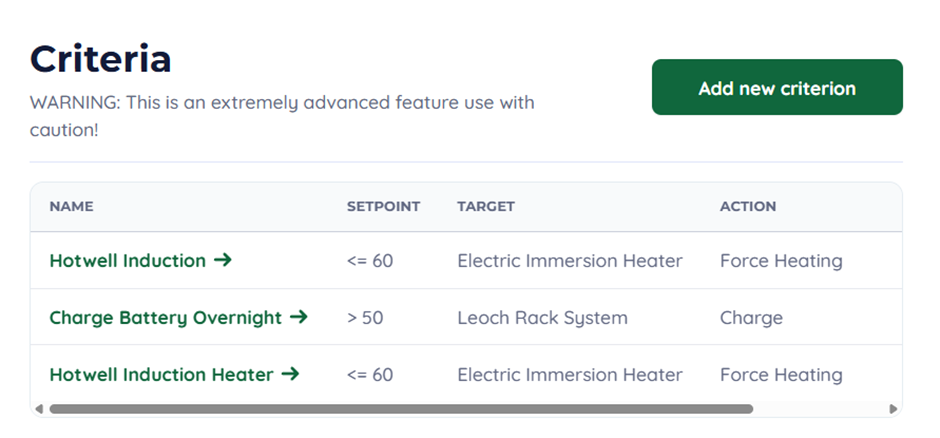
Once added, it will appear in the list.

Sometimes you may want multiple overlapping criteria on the same target. In this case priority becomes important. If two criteria are met in the same modelling frame, the highest priority action will be taken.
Event Conditions
Event conditions are like operational criteria but instead produce additional demands for a network. You can find them at the bottom of either the electrical demand or heat demand pages.
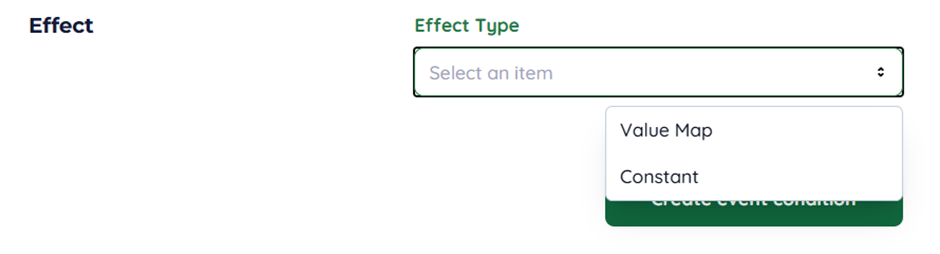
The source and trigger work in the same way; however, the effect is a choice between either a constant value or a value map. Caution, unlike operational criteria, these do not have a priority, and multiple events can trigger at once.
Forecasts
Forecasts are a short-range prediction for the performance of your project. These use real-time weather data and a shorter modelling frame to allow you to see what’s going on in greater detail. It also combines a lot of features from the headroom page.
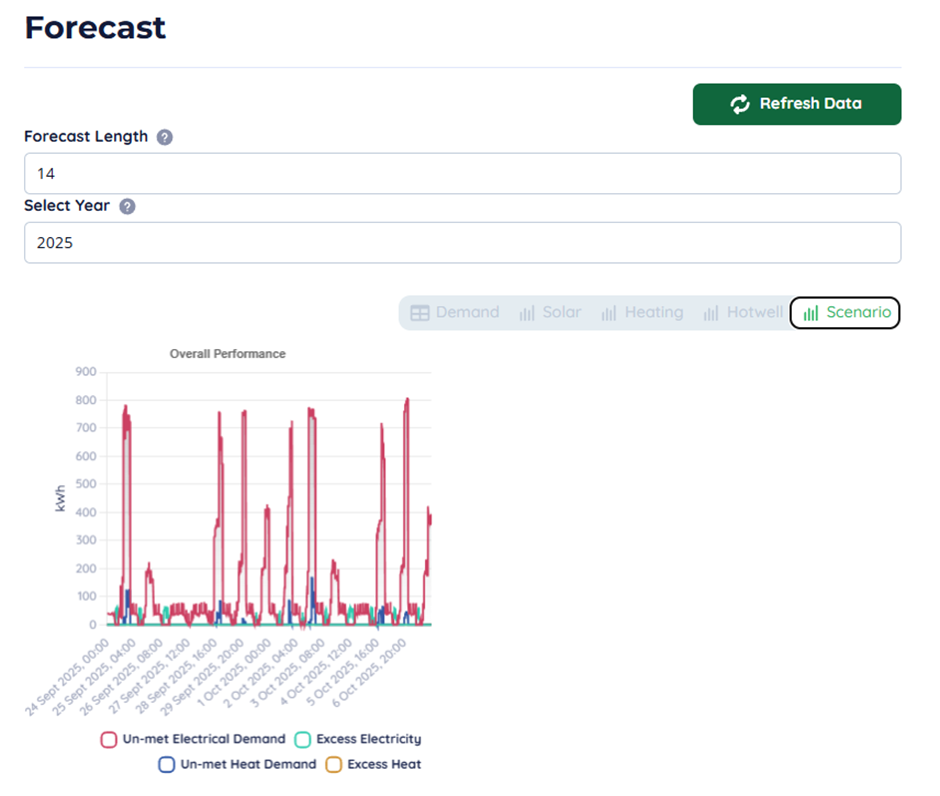
Select the forecast length to control how many days are available in the graphs. Then select the year if you want to see what the project performance might be using the next two weeks of weather in a different year in the future.
Gas Turbines
Gas turbines have complex ramping startup and shutdown requirements; as such they have approaching two dozen parameters to be able to be modelled properly in Encast.
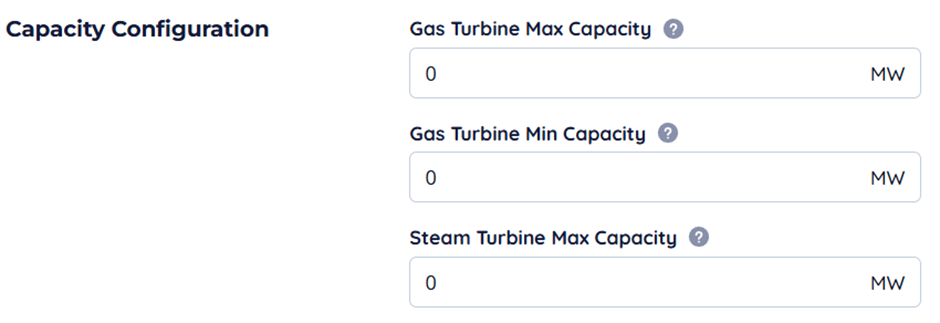
To start with, define the capacity of the turbine in MW. Below the minimum capacity of the gas turbine, it will shut down if already running or not run.
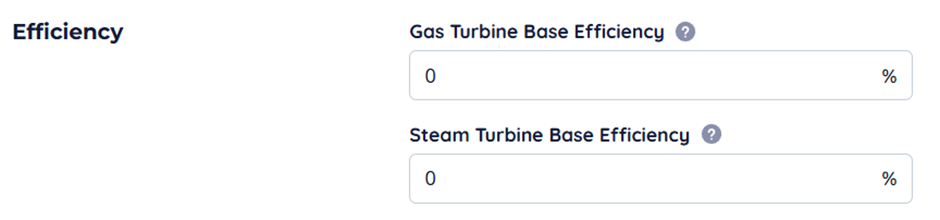
Then define the efficiencies. Note that these are separate from each other, do not use the combined efficiency of a turbine for this data. Say, for example, the gas turbine has an efficiency of 38% operating in a simple cycle, but the datasheet gives a nominal combined cycle of 55%. To work out the steam turbine base efficiency, you need to do some algebra.
Where
Rearranging for
Now this may seem complicated, however, in reality the efficiencies of both turbines vary across their load bands and must be calculated separately. This is just an example, but some manufacturers may give you better data; the reason this is also not defined in part like other modules is that CCGT plants can have wildly different efficiencies for heat recovery even with the same gas turbine.
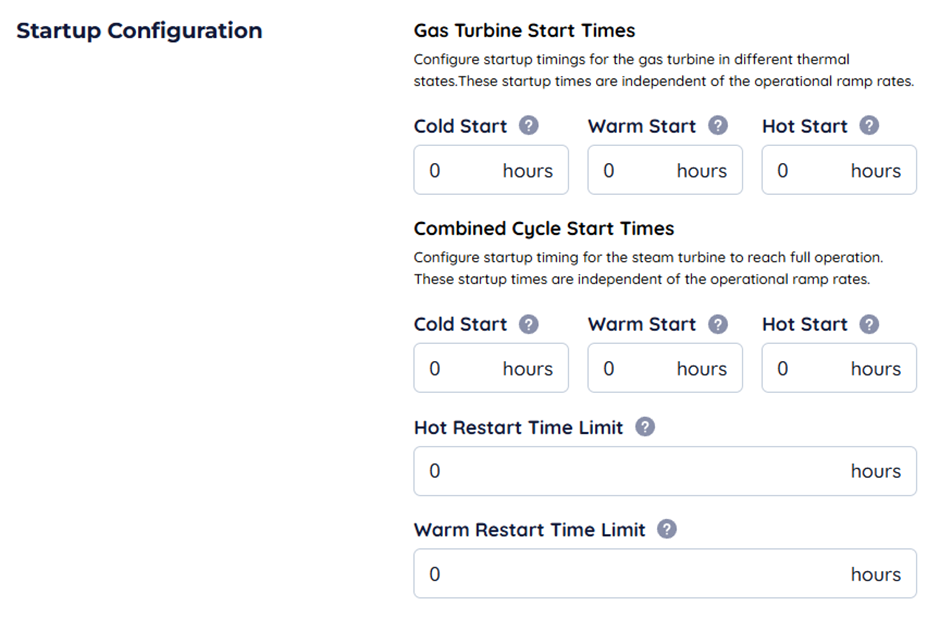
Plant design also affects start times and restart times. Some operators also prioritise the longevity of the turbine, so longer shutdowns may be required to reduce stress on parts and to prevent an excessive number of plants starts.
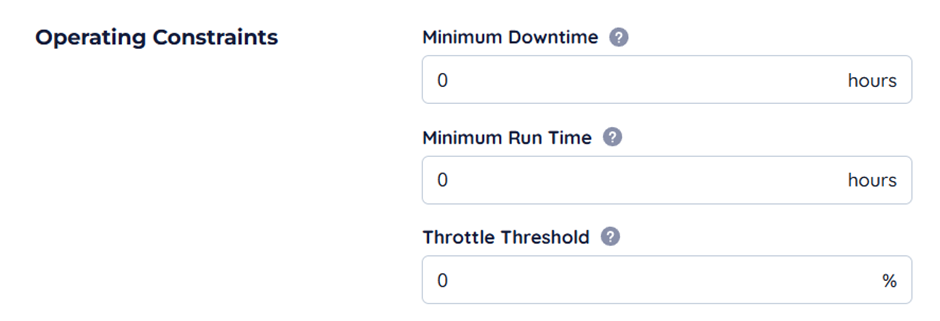
Minimum downtime is the amount of time the turbine must remain off after being shut down. The minimum runtime is obviously how long the generator must remain running. A throttle threshold operates in the same way as a lower setpoint on a RICE generator, if for whatever reason, that is above the minimum load of the gas turbine.
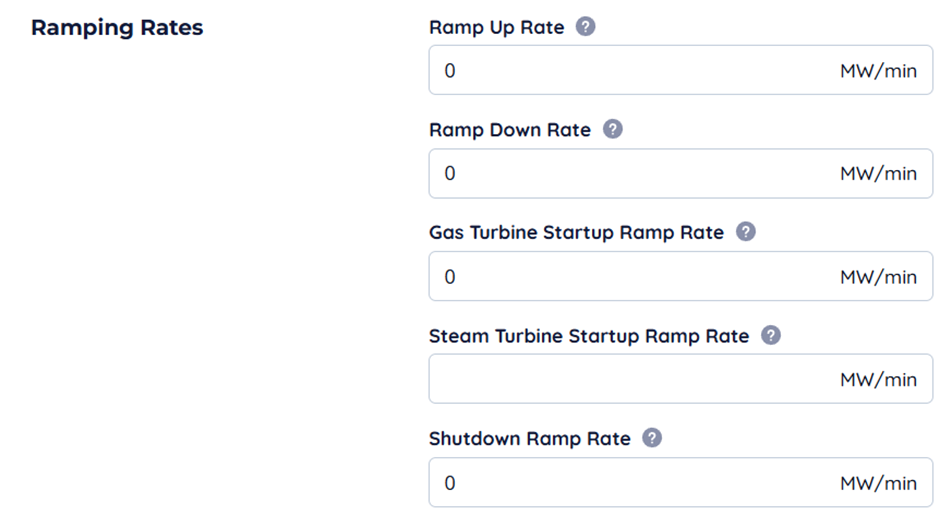
Due to the rotating mass, unlike most other modules, turbines require ramp-up and ramp-down time. For aeroderivative turbines this might not matter as they are designed to ramp up and ramp down quickly and not have a hot lockout period. With more performant turbines
Turbines become less efficient in warmer weather. The standard reference temperature is 15°C.